Question: You’re making a sign using a marker to draw the letters. The marker tip is a circle that’s $2\text{ cm}$ across. If you want the marks to be as uniform as possible (as measured by the standard deviation of the ink intensity), and you can’t place the tip within $1\text{ cm}$ of where it’s previously been, how far apart should you make the marks?
Solution
The major insight here is that the marker leaves ink in proportion to the surface area it has dragged over the surface. If we drag the tip in a straight line, then the ink trail will be most intense at the center, and it will taper to zero intensity $1\text{ cm}$ from the center.
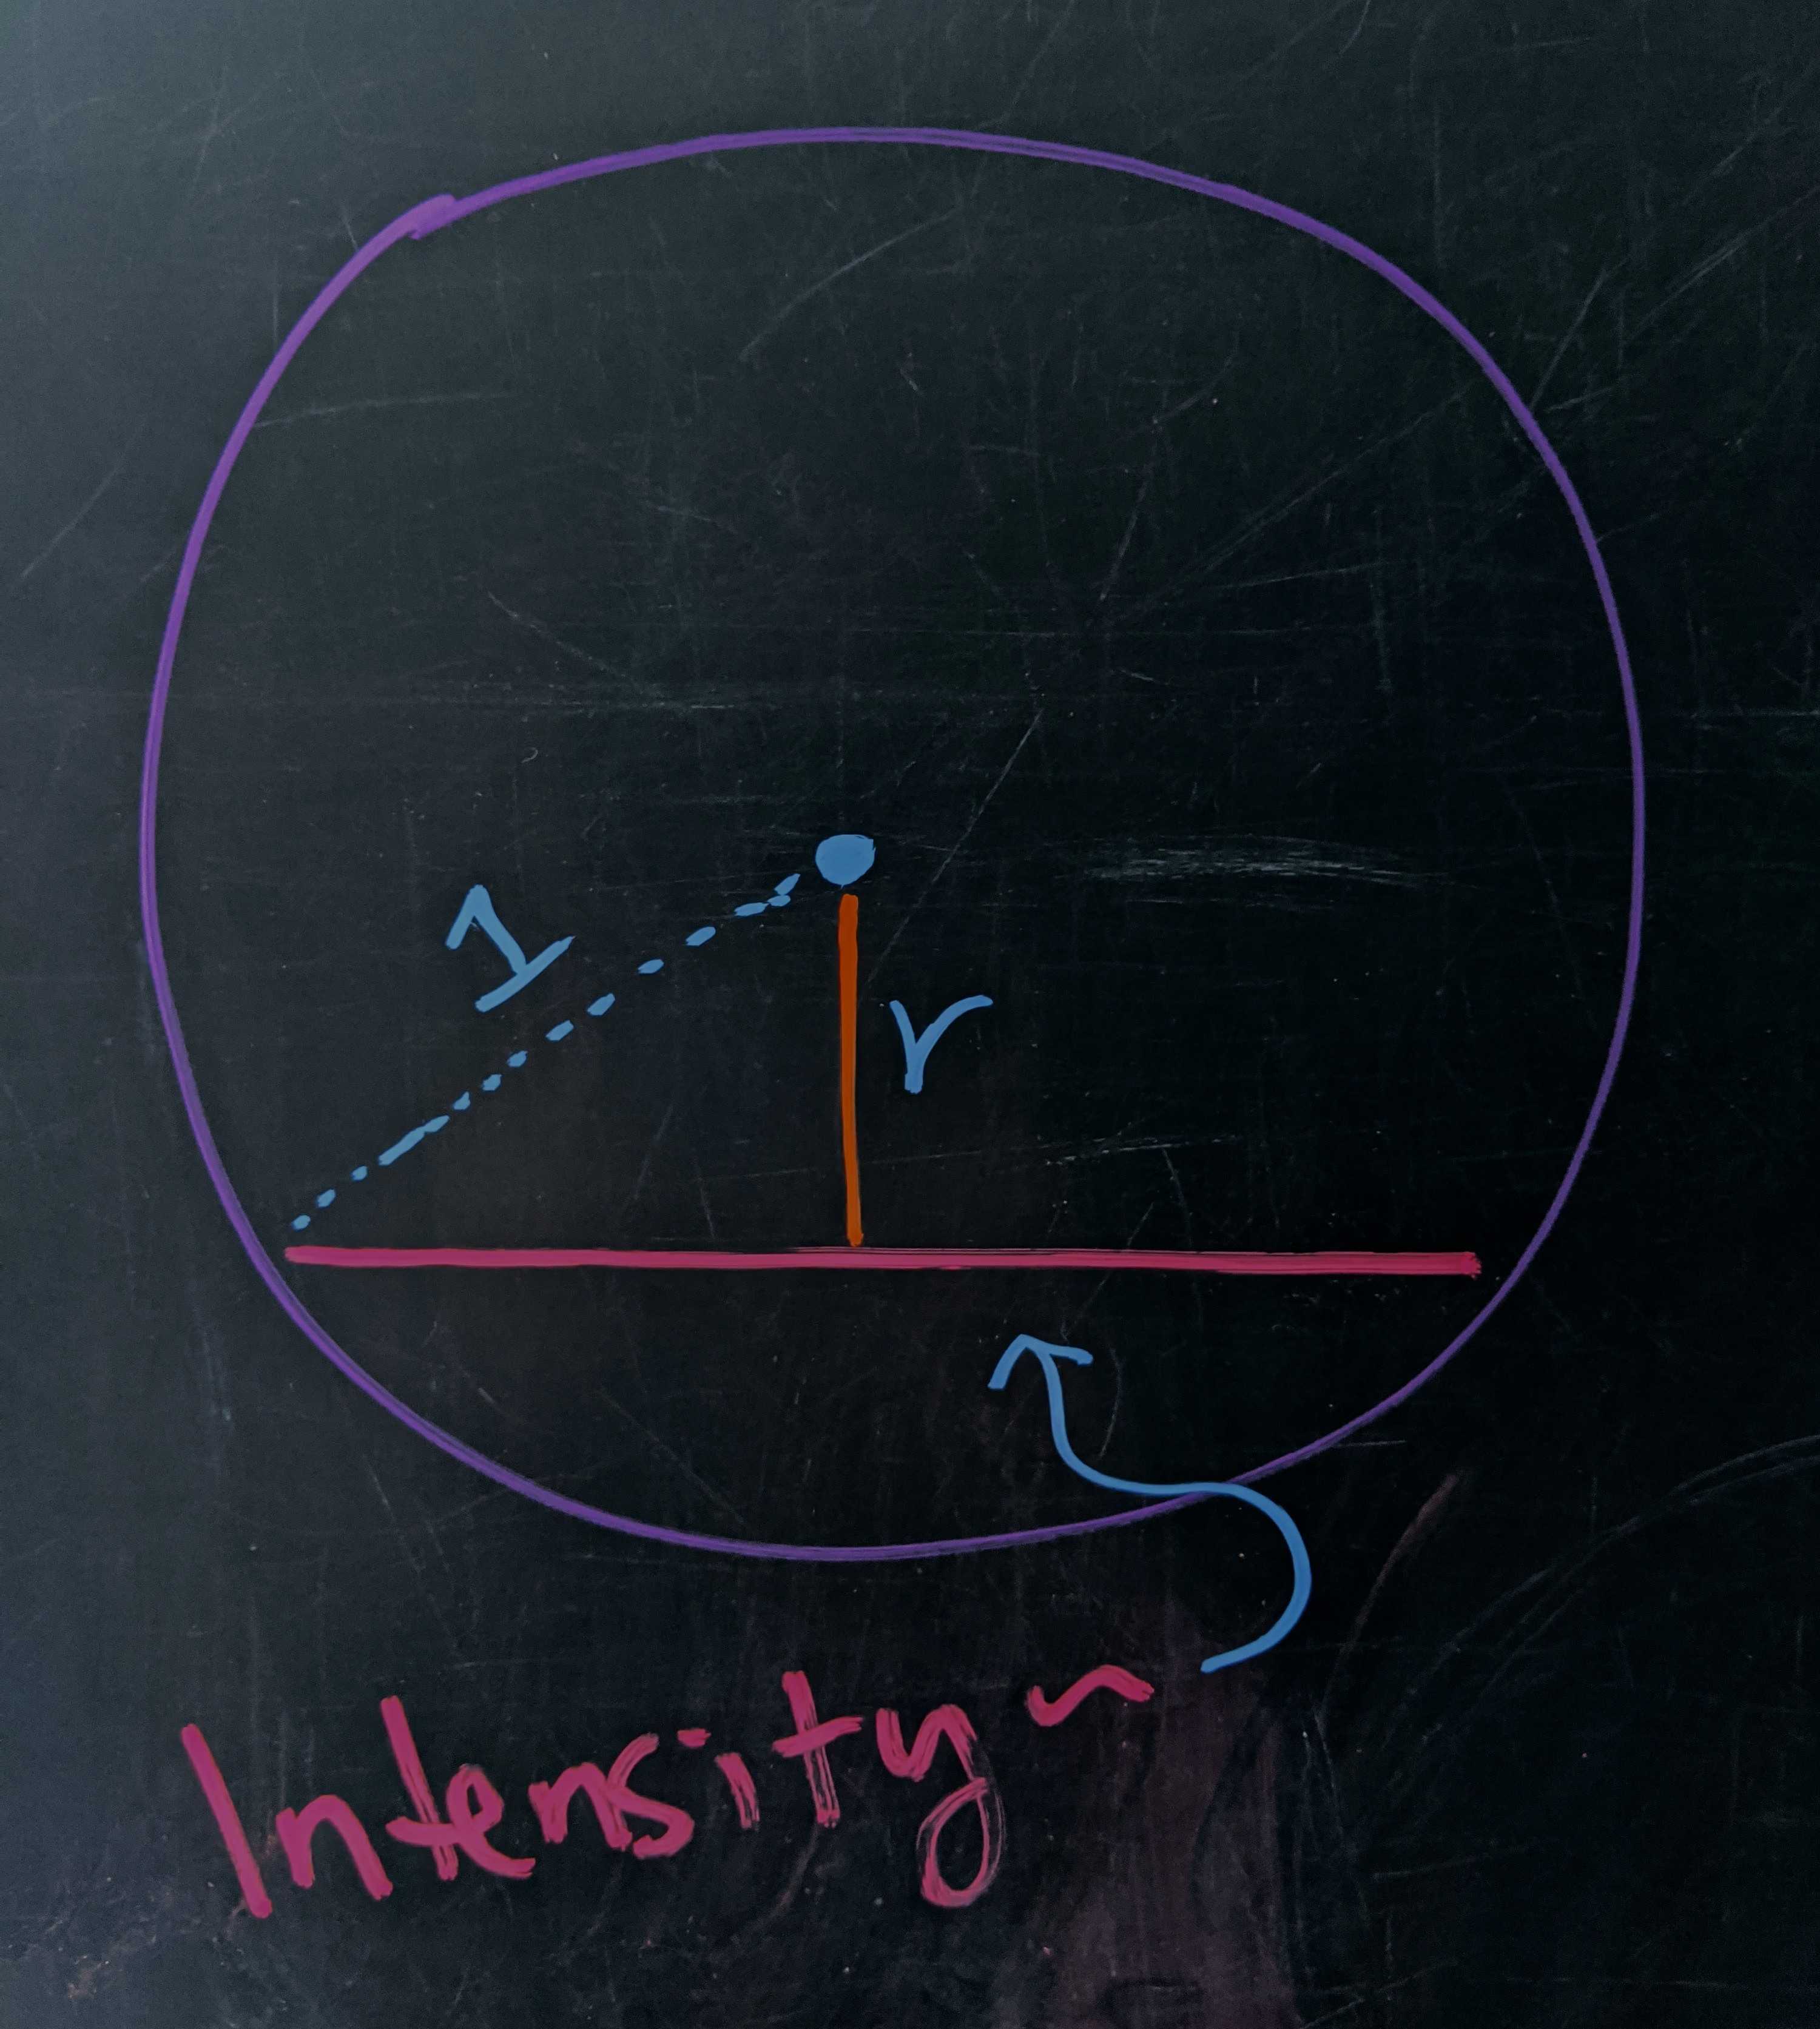
Intensity diagram *the intensity of the mark left a distance $r$ from the tip’s center is proportional to fraction of the circle’s surface area that drags past the point, i.e., the length of the pink chord at $r.$ Using the Pythagorean theorem, the chord has length $\ell = 2\sqrt{1 - r^2}.$
This intensity profile is described by some function $I(r)$ that’s $1$ at the center and zero at the edge. What is it? The relative surface area that the tip drags a distance $r$ from the center is proportional to the length of the chord at that radius. Looking at the diagram, the triangle reveals that $I(r) \sim 2\sqrt{1-r^2}.$ If we add this up from the center to the edge, we get $\pi/2,$ so the normalized profile is
\[I(r) = \frac{4}{\pi}\sqrt{1-r^2}.\]This shows how the ink trail would look from above:

The intensity of the marker falls decays with the length of the chord that’s swept out at radius $r.$
Close, but not too close
By definition, all marks on the sign will be built out out of parallel marker trails.
If we keep a distance of $1\text{ cm}$ between the parallel marker trails, then the sign will be an undulating tapestry of varying intensity, disorienting all who gaze upon it. Overlapping the trails can even out the profile, but if we bring them too close together, the centers will be very thick and we’ll be back in the uneven ink hall of fame.
Overlapping trails
So how far apart should we make them?
First of all, let’s encapsulate the insight from above. If a marker tip is dragged over a point a distance $r_1$ from its center, then the ink intensity on that spot will be $I(r_1).$ By extension, if another tip drags over the same point a distance $r_2$ from its center, then the intensities add:
\[I_\text{total} = I(r_1) + I(r_2).\]The standard deviation is equal to the square root of the average value of the squared intensity minus the square of the average intensity.
\[\sigma^2 = \langle I_\text{total}^2\rangle - \langle I_\text{total}\rangle^2\]If there’s no undulation in the intensity then this will be zero, but if there are peaks and valleys, it will grow. Where is it least?
The average value of the intensity is sum of intensity from one tip center to the other, divided by the distance that separates them:
\[\langle I_\textrm{total}\rangle = \frac{1}{d} \int_0^d dr\, \left(I(r) + I(d-r)\right),\]and the average squared value is
\[\langle I^2_\textrm{total}\rangle = \frac{1}{d} \int_0^d dr\, \left(I(r) + I(d-r)\right)^2,\]and the standard deviation is
\[\sigma = \sqrt{\langle I_\text{total}^2\rangle - \langle I_\text{total}\rangle^2}.\]We can calculate $\sigma$ like so:
import numpy as np
import pandas as pd

inc = 0.0001

def I(r, d):
  """returns the ink intensity at point r due to a marker tip at d"""
  if 1 - (r - d) ** 2 >= 0:
    return 2 / np.pi * np.sqrt(1 - (r - d) ** 2)
  else:
    return 0

def intensity_series(d):
  """returns an array of the intensity at all points between the two tips"""
  return [I(r, 0) + I(r, d) for r in np.arange(0, d, inc)]

# initialize dataframe with separation values
df = pd.DataFrame(np.arange(1, 2, inc), columns=["separation"])

# calculate intensity series for each value of the separation
df["intensities"] = df["separation"].map(intensity_series)

# calculate the standard deviation of the intensity series for each separation
df["stddev"] = df["intensities"].map(np.std)

# find the separation that has the minimal standard deviation of ink intensities
min_index = df["stddev"].idxmin()
smoothest_separation = df.loc[min_index]["separation"]
Which gives $d_\text{smoothest} \approx 1.692\text{ cm}$ as seen in the plot of $\sigma$ vs $d$:
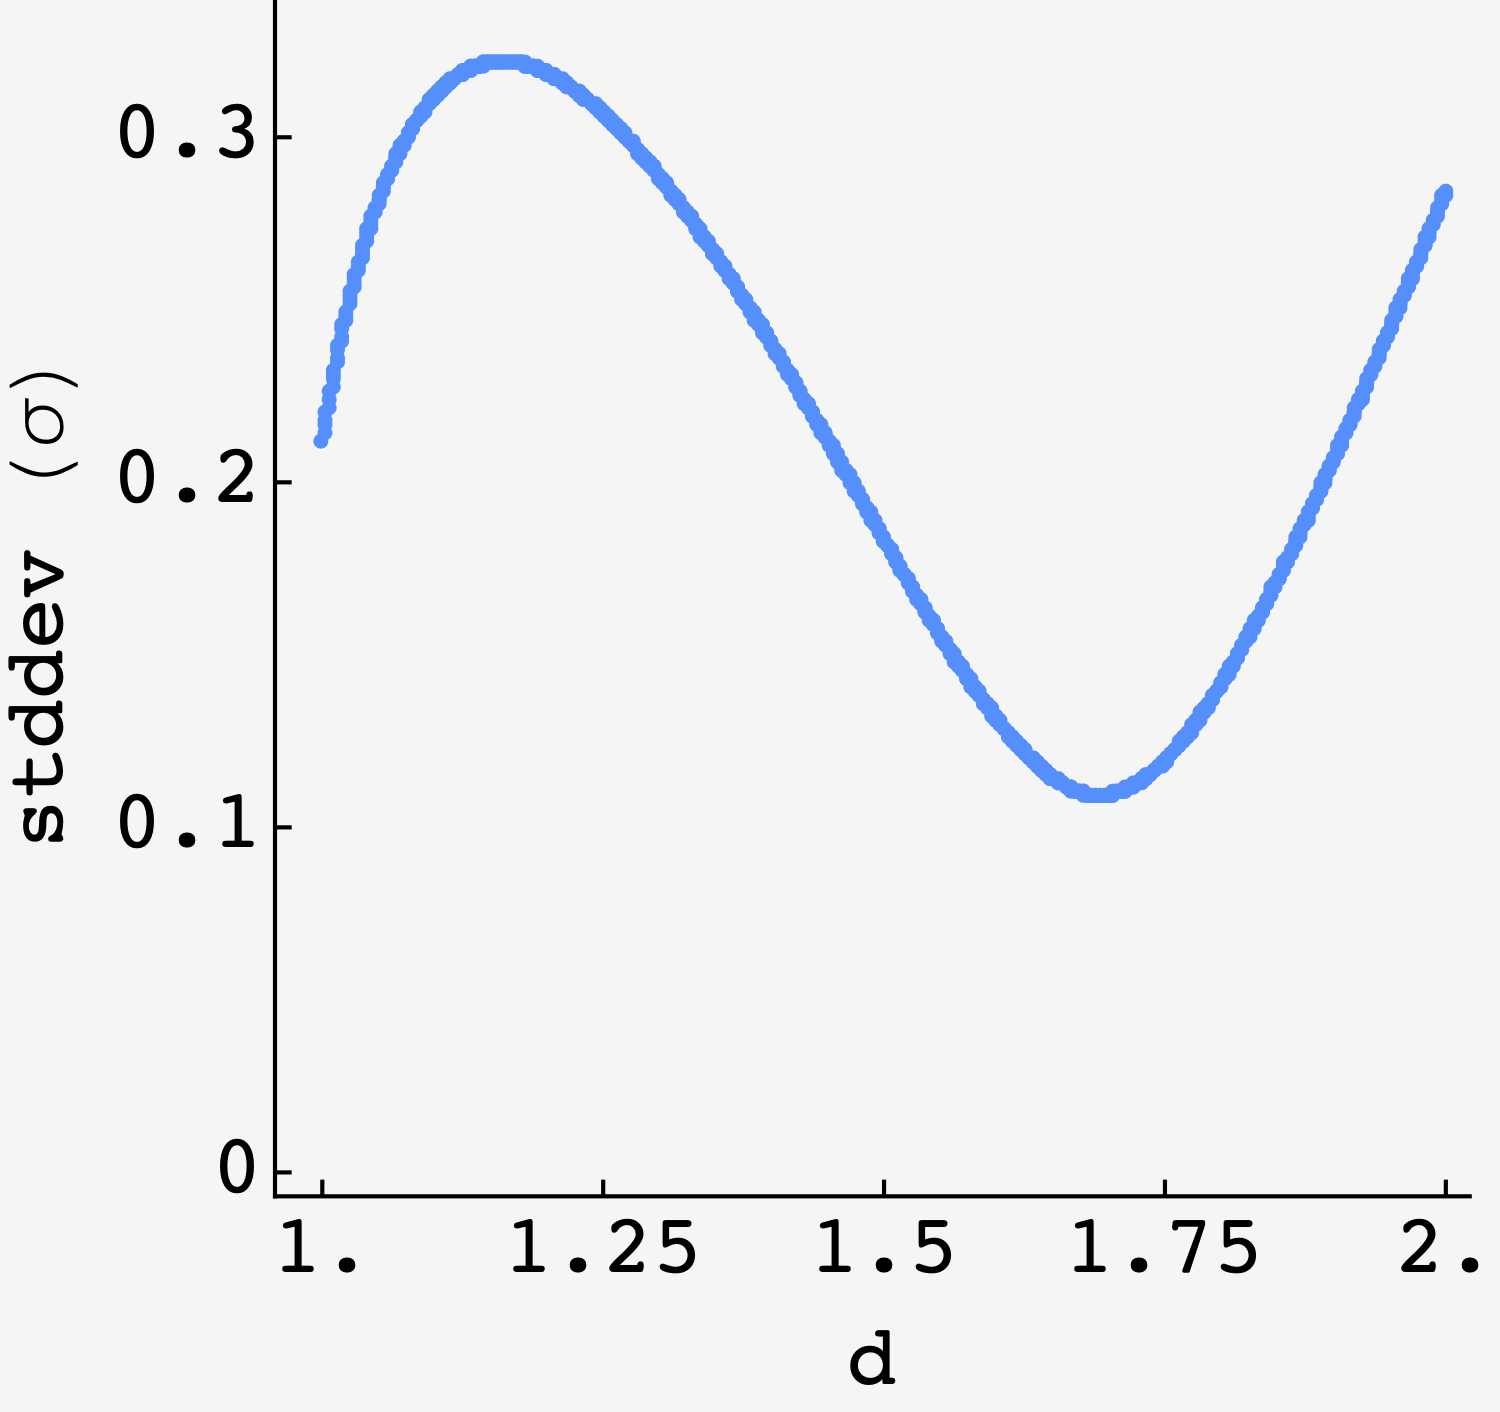
The standard deviation is minimized around $d = 1.692\text{ cm}.$
This is palpable if we look at the post as $d$ changes. Bands of light and dark are present at all values, but they’re diminished in the neighborhood of $d\approx 1.692\text{ cm}$:
Top: density plot of ink intensity in a region with a drawn letter as the two market tips move closer together. Bottom: zoom in on two overlapping marker trails, (red) and (blue) show the profiles of the left and right hand trails, (black) shows their superposition ($I_\text{total}$), and (gold) shows the mean intensity of ink in the letters. Around $d_\text{sep} \approx 1.69,$ the variation of $I_\text{total}$ about the mean is minimized.